
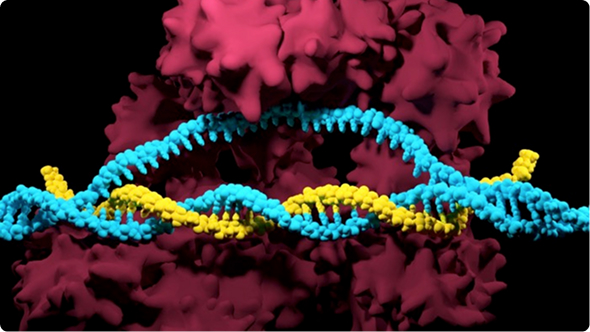
You have just finished transfecting your cells with a CRISPR-Cas complex for your experiments. It is now time to analyze your cells genomes to determine if you were successful in inducing your genomic edit. In this chapter, we have summarized the major CRISPR analysis tools and methods scientists use to evaluate the results of their CRISPR experiments.
The methods available to analyze CRISPR editing efficiency vary depending on the type of mutation you wish to introduce into your cells, with varying levels of complexity.
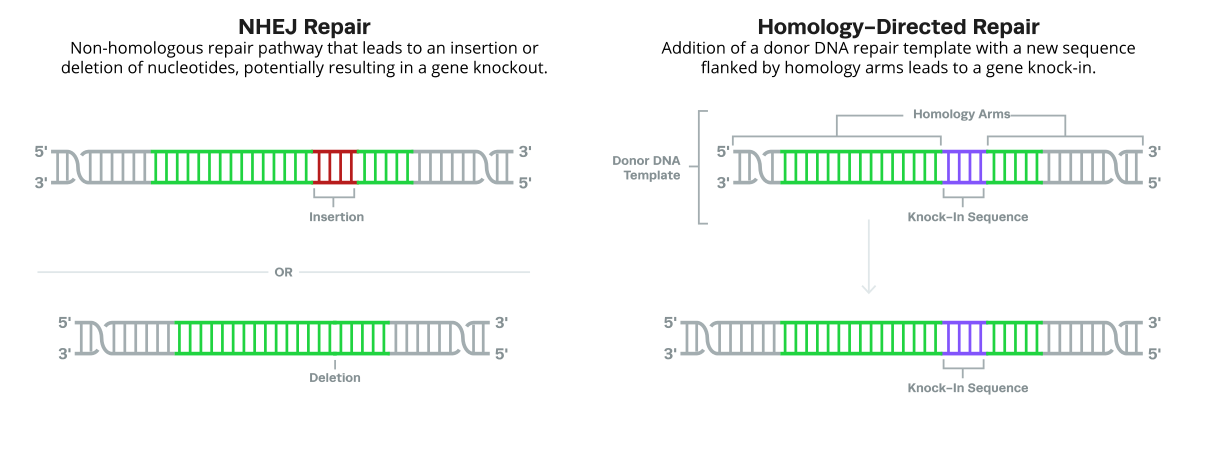
Whether your experiment is using HDR or NHEJ, many CRISPR analysis methods rely on PCR amplification of the edited region as a first step. Depending on the method, subsequent Sanger sequencing of both control (non-edited) and experimental (edited) samples are used to analyze the degree or extent of CRISPR editing (editing efficiency) and spectrum of editing events (clonality). Non-sequencing based approaches rely on manipulation of the resulting PCR product to determine changes.
The gold standard of analyzing CRISPR editing involves targeted next-generation sequencing to perform deep sequencing on the region of interest using NGS. Targeted NGS is an extremely sensitive method of detecting editing outcomes, and the high-throughput sequence-based data provides a comprehensive view of the indels generated. This level of detailed data analysis does not come cheap. NGS is an extremely time- and labor-intensive process that includes many steps from DNA extraction to sequencing and analysis, which are not amenable to smaller labs or small-scale CRISPR studies. Therefore, NGS is most effective when the number of samples is high, you have access to a bioinformatics team, and your budget allows for it.
It is not practical for many researchers to use NGS to analyze all of their CRISPR editing experiments. If you are not able to embark on committing to NGS to validate your CRISPR experiments, don’t worry, you are not alone! Alternative cost-friendly analysis tools are available and described below.
Synthego developed a user-friendly online tool called Inference of CRISPR Edits (ICE) to analyze CRISPR data (now hosted by our friends at EditCo). ICE uses Sanger sequencing data to determine the relative abundance and levels of indels due to CRISPR editing, making it significantly more cost-effective compared to using NGS.
ICE software aligns the unedited sample to the original sgRNA sequence, followed by alignment of unedited and edited samples to determine the differences between samples. The ICE tool will then calculate editing efficiency (producing an ICE score, which corresponds to indel frequency) and provide detailed information on the different types and distributions of indels generated in your sample. Moreover, the ICE software can detect unexpected editing outcomes such as large insertions or deletions without any additional time or cost.
The ICE tool is highly accurate. When compared to NGS, ICE analysis results were highly comparable (R² = 0.96), providing users the ability to achieve NGS level results without breaking the bank.
Some key features of the ICE software include:
TIDE is an older method to analyze CRISPR editing results using Sanger sequencing data. TIDE initially represented an attractive alternative to NGS due to the lower cost of Sanger sequencing, but it has several limitations that were never overcome.
Similar to ICE, TIDE software aligns your sgRNA sequence to your unedited and edited samples. Following alignment, TIDE software decomposes the sequencing data using the unedited sequence as a template to compare to, resulting in an estimation of the relative abundance and level (or number) of insertions or deletions in your sample compared to your unedited controls. The software also provides a goodness of fit R² value and assesses the statistical significance of each insertion or deletion identified.
For insertions of a single base pair (also referred to as +1 insertion), TIDE software can infer or predict what nucleotide is inserted. This capability is primarily used for +1 insertions, rather than other indel types, since predictions of longer insertions are more complex and require manually changing the settings of the TIDE software to achieve best results. Although the TIDE analysis web tool allows the user to modulate specific settings for their analysis such as alignment and decomposition window, these parameters might be difficult to modify with confidence for the average user.
In the T7E1 assay, your region of interest is PCR amplified, however, unlike the other methods, the T7E1 assay does not use DNA sequencing to determine CRISPR editing efficiency. The T7E1 assay takes advantage of the T7 endonuclease, which preferentially cleaves mismatched DNA.
Following PCR amplification, the PCR product is denatured and re-annealed through a series of heating and cooling steps. The re-complexed product will result in heteroduplexed DNA. T7E1 recognizes and cleaves DNA duplexes that contain mismatches, so edited regions will be cleaved and generate smaller-sized DNA fragments that are visualized by agarose gel electrophoresis.
This method can be used to identify the presence of CRISPR-generated mutations, but it is not quantitative and does not provide information on the different indel sequences generated. The T7E1 assay is sometimes used as a first test while optimizing CRISPR conditions when precise analyses are not necessary because it is the cheapest and fastest method to perform.
Now that you have familiarized yourself with the various ways to analyze your CRISPR data, how do you know which one to choose? The method you choose depends on your available time and budget as well as the level of detail you wish to obtain in the analysis.
Even though NGS is the gold standard because of its high accuracy and sensitivity, it is only useful when you have a large number of samples and funds, and access to bioinformatics to support the analysis. If NGS is not in your budget, ICE and TIDE software tools offer cost-effective alternatives that provide sequence level data and statistical significance for indels identified. Between the two, ICE has greater capabilities compared to TIDE since it can detect more editing outcomes, including large insertions or deletions. Additionally, ICE has been demonstrated to be comparable to NGS, meaning you get the cost-effectiveness of Sanger sequencing without sacrificing accuracy.
If you do not need to look at detailed nucleotide level changes, and just need to know if there was editing or not, the cheapest option is a non-sequencing based method such as the T7E1 assay. While it lacks the sequencing level data, it does still provide you with general editing information by agarose gel electrophoresis. Post-hoc analysis of your bands can be used to calculate the estimated gene editing efficiency.
Whichever method you choose, it is extremely important to validate the results of your CRISPR experiment before moving onto the next steps in your project. Hopefully this article has given you a better idea of the methods and tools available to start the validation process.
If you have any questions about this article or CRISPR editing in general, please feel free to contact us our Technical Support Team.
ICE is a powerful analysis tool that provides quantitative, sequence-level data for analyzing your CRISPR edits. If you would like to try out ICE for your own results, check out the detailed guide on ICE.
CRISPR has quickly become a standard laboratory tool for gene editing. As the adoption of CRISPR accelerates worldwide, up-to-date knowledge of the basics of CRISPR is essential for anyone in...
CRISPR has ignited a revolution. Although it’s a relatively recent discovery in the history of biotechnology, CRISPR has quickly become a standard laboratory tool and is transforming cell engineering-based research....
Confused about chemical modifications on CRISPR guides? Join us as we explore why chemical modifications are so important, the different types and their applications, and how Synthego’s modified guides can...
 Cart
Cart
 Account
 Your Orders
 Sign Out
 Sign In